The latest Austin real estate market report is out. Across the country, investors are moving more and more money into real estate.
Median Sales Price
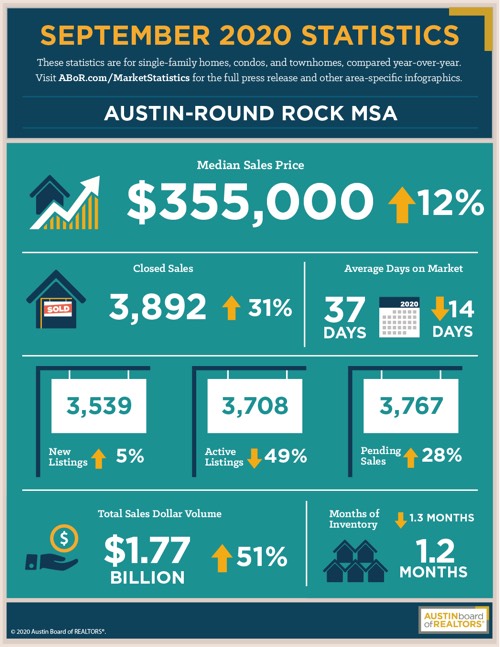
The actual value stayed flat Month-Over-Month (MoM), but the 12% is the better of the two numbers to watch anyway, as it represents Year-Over-Year (YoY) growth. We like this number to remain steady positive, as it indicates a healthy active market. Austin is typically around 6%, so we’re definitely seeing strong price growth, and consequently the value of our investments continuing to yield high returns!
New/Active Listings
The 49% price drop in active listings is the number to pay attention to. This is continued support that we are still climbing into seller’s-market territory. Fall is traditionally a slow time for real estate, so the fact we’re seeing active listings fall disproportionately with new listings means that buyers are continuing to eat up inventory.
ADOM | MOI
You know that I like to look at Average Days on Market (ADOM) and Months of Inventory (MOI) to tell the real picture. We’re seeing continued decline in inventory both MoM and YoY. This means that not only are we at record low inventory levels, we still haven’t hit the bottom yet!
I said this last month and will continue to harp on it… If you’re a buyer sitting on the sidelines worried about the COVID market, that is now old news. Across the country, the market is booming as investors move more and more money into real estate. This creates a compounding effect by driving up prices so fewer and fewer people can then afford to move, thereby further reducing the inventory pool and driving up prices even further. Now is the time to focus less on cash flow and more on appreciation. Cash flow is easily improved down the road, but appreciation comes almost exclusively by riding the wave.
And there you have it for this month’s real estate market report. Happy hunting!
Source/credit: Austin Board of REALTORS®
Read more real estate investing articles like this on the Ten Properties blog


