A rebound to healthy liquidity in connection with a drop in inventory and rise in price pushes us into a slight seller’s market territory.
July numbers are out. The headlines will read “Housing sales up 21%”, but we, as data driven investors, know better than to follow headlines. Let’s take a look…
Closed Sales | Total Sales Dollar Volume
Sales are up simply because the market has been so suppressed by COVID-19. Granted, a high Closed Sales number is also indicative of a healthy liquid market, which is generally good for both buyers and sellers, it doesn’t tell us much more than that.
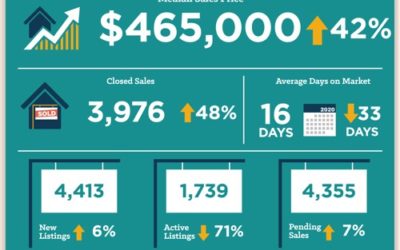
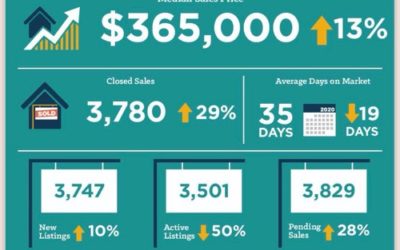
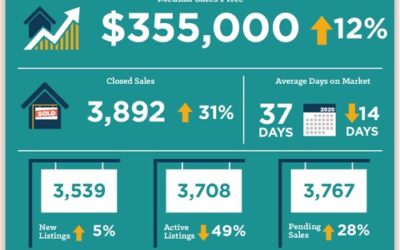
Median Sales Price
This is a good metric to look at as investors. In combination with a liquid market, this number gives us a glimpse into whether this is a “seller’s market” or “buyer’s market”, the real thing we want to know. We all want to see our home values go up by 10%, but this number isn’t exactly that because it can be skewed by larger, more expensive homes. If enough people bought $1M+ homes, this number would go up, even though the rest of us could see our property values decline.
ADOM | MOI
I like to look at Average Days on Market (ADOM) and Months of Inventory (MOI) to tell the real picture. While ADOM is still high (mostly due to COVID-19), it came down 3 days. That in connection with a HUGE 1 month drop in inventory tells me this trending towards a sellers market, per our laws of Supply & Demand.
And there you have it for July. Happy hunting!